Coastal erosion in East Yorkshire
As there is no longer a family home to stay in when visiting Mum in Hull, we’ve been staying at the lovely West Carlton Country Guest House in Aldbrough, East Yorkshire when we visit. This is a perfect place for me as it is just the right distance from Hull to make it not so familiar that there are memories hiding at every corner (which was part of the problem when I stayed at a B&B in Hessle) but close enough to be able to visit her within 20 or 30 minutes. As a result, we’ve been exploring the East Yorkshire coastline a bit more, and I’ve been pretty shocked to see how quickly it is receding.
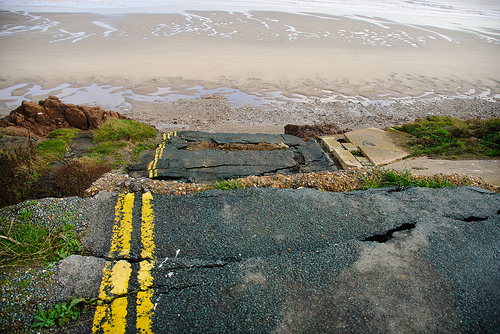
Last year we stopped by Aldbrough and found this:
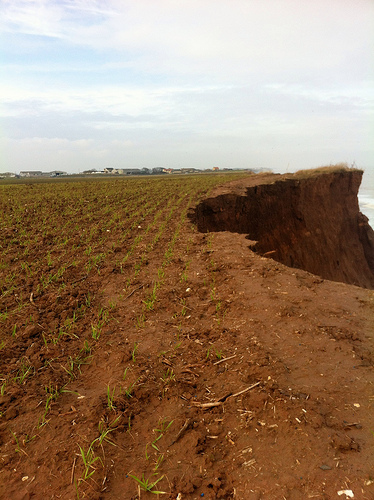
then this November, we visited Withernsea and saw some obviously recent cliff loss (look at the seedlings):
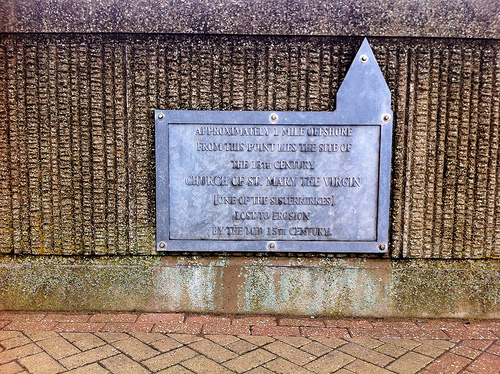
and a record of a previous land loss:
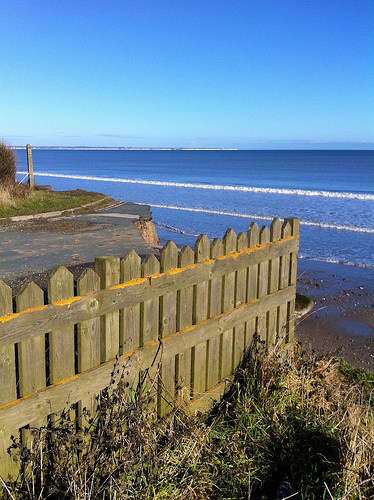
and then we stopped by Skipsea:
Probably as a result of working with an environmental risk agency and so being surrounded by environmental surveyors and geologists every day I started thinking about just how much of the coast was dropping off, and what it meant, and so I put a few hours aside today to do a bit of research.
The East Yorkshire Coastal Explorer site seems to have quite a good level of information, with links to documents like the Coastal Information Pack (1 - Development of the East Riding Coastline, 2 - Coastal Processes, 3 - Coastal Monitoring, 4 - Defending the East Riding Coastline and 5 - Spurn Peninsula), the Cliff erosion data table produced in March 2012 and Cliff erosion loss data from 1852 until March 2012 which made it much easier to get an idea of the scale of the erosion.
I found the latter document to be fascinating, as it shows on a place by place basis what the erosion levels have been between surveys (initially using the OS historical maps data, and then supplementing that with 6-monthly GPS and later LIDAR surveys). Profile 62, close to where the Aldbrough photo above was taken, has lost around 216 metres of coastline since the 1852 OS map survey was made. This is made obvious by this image showing the 1852 map overlaid onto an aerial photo from 2000 and this 2011 photo study of recent erosion in Aldbrough. A little over 40 metres of that land loss has occurred just in the past 10 years (since that overlaid map image was made). That’s a lot of land to lose, and to lose so quickly. This map gives names to some of towns and villages that have already been lost and I can’t help but wonder how many more places will be listed on a similar image in a further 20-30 years time.
All in all, a few hours well spent, getting to understand a bit more about coastal erosion, and especially how overlaid maps can be used to give a useful, useable and understandable context.